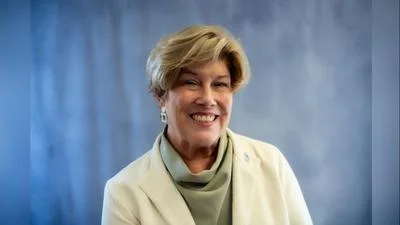
Tony Sanders State Superintendent of Education | Official Website
Tony Sanders State Superintendent of Education | Official Website
Of the 26,039 students attending Peoria County schools, 48.9% were white. African American students were the second largest ethnicity, making up 29.2% of Peoria County students.
In the previous school year, white students were also the most common group in Peoria County, representing 50% of the student body.
Richwoods High School had the most even distribution of races among county schools, including 36.1% white students, 33.1% African American students, 14% Hispanic students, 12.8% multiracial students, and 3.5% Asian students.
The Illinois State Board of Education’s budget for fiscal year 2026 will increase from nearly $10.8 billion to about $11.2 billion. This includes a $307 million boost for K–12 schools, marking the smallest annual increase since 2020.
The agency has paused about $50 million in funding previously allocated through the Evidence-Based Funding formula for the Property Tax Relief Grant while reviewing its impact on local tax relief. Officials say the pause could affect the timing and amount of property tax relief available to taxpayers.
| School name | Most prevalent ethnicity | Percent of Total Student Body | Total Enrollment |
|---|---|---|---|
| Banner Elementary School | White | 63.3% | 392 |
| Bartonville Elementary School | White | 64.3% | 291 |
| Brimfield Grade School | White | 94.7% | 394 |
| Brimfield High School | White | 97% | 201 |
| Calvin Coolidge Middle School | African American | 72.6% | 317 |
| Charles A. Lindbergh Middle School | African American | 36.2% | 282 |
| Charter Oak Primary School | African American | 49% | 343 |
| Chillicothe Elementary Center | White | 88.7% | 159 |
| Chillicothe Junior High School | White | 87.4% | 239 |
| Dr. C.T. Vivian Primary School | African American | 60.6% | 398 |
| Dr. Maude A. Sanders Primary School | African American | 70.4% | 389 |
| Dunlap Grade School | White | 76.6% | 252 |
| Dunlap High School | White | 63.2% | 1,384 |
| Dunlap Middle School | White | 53% | 525 |
| Dunlap Valley Middle School | White | 59% | 581 |
| Elmwood Elementary School | White | 91.2% | 328 |
| Elmwood High School | White | 93.5% | 199 |
| Elmwood Junior High School | White | 91.8% | 97 |
| Farmington Central Elementary School | White | 92.4% | 621 |
| Farmington Central High School | White | 91.7% | 362 |
| Farmington Central Junior High School | White | 94.4% | 250 |
| Franklin Primary School | African American | 72.1% | 344 |
| Glen Oak Community Learning Center | African American | 61.6% | 617 |
| Harrison Community Learning Center | African American | 55% | 575 |
| Hickory Grove Elementary School | White | 48.1% | 837 |
| Hines Primary School | African American | 59.3% | 403 |
| Hollis Consolidated Grade School | White | 92.4% | 144 |
| Illini Bluffs Elementary School | White | 92.3% | 417 |
| Illini Bluffs High School | White | 92.2% | 245 |
| Illini Bluffs Middle School | White | 89.6% | 182 |
| Illinois Valley Central High School | White | 89.9% | 623 |
| Kellar Primary School | White | 47.1% | 348 |
| Limestone Community High School | White | 70.8% | 883 |
| Limestone Walters Elementary School | White | 94.4% | 177 |
| Lincoln School | African American | 49.4% | 741 |
| Manual Academy | African American | 68.4% | 637 |
| Mark W. Bills Middle School | African American | 59.9% | 252 |
| Monroe Elementary School | White | 84.9% | 272 |
| Mossville Elementary School | White | 89% | 409 |
| Mossville Junior High | White | 87.7% | 187 |
| Northmoor Primary School | African American | 42.3% | 369 |
| Norwood Elementary School | White | 80.9% | 141 |
| Norwood Primary School | White | 76.9% | 212 |
| Oak Grove School | White | 83% | 270 |
| Peoria Heights Grade School | White | 55% | 505 |
| Peoria Heights High School | White | 56.8% | 199 |
| Peoria High School | African American | 66.5% | 1,244 |
| Pleasant Hill Elementary School | White | 43% | 165 |
| Pleasant Valley Elementary School | African American | 59.4% | 224 |
| Pleasant Valley Middle School | African American | 58% | 181 |
| Princeville Elementary School | White | 85.4% | 301 |
| Princeville High School | White | 88.5% | 330 |
| Quest Charter School Academy | African American | 68.3% | 400 |
| Richwoods High School | White | 36.1% | 1,504 |
| Ridgeview Elementary School | White | 55% | 424 |
| Rolling Acres Middle School | African American | 45.3% | 331 |
| Roosevelt Magnet School | African American | 87.6% | 587 |
| South Elementary School | White | 90.8% | 424 |
| Sterling Middle School | African American | 74.5% | 326 |
| Trewyn Primary School | African American | 75.4% | 414 |
| Von Steuben Middle School | African American | 68% | 219 |
| Washington Gifted School | White | 60.6% | 292 |
| Whittier Primary School | African American | 41.5% | 323 |
| Wilder-Waite Elementary School | White | 52.9% | 357 |
Information in this story was obtained from the Illinois State Board of Education. The source data can be found here.


 Alerts Sign-up